Last revision: January 18, 2022
Debugging a complex application such as WordPress isn't an easy task. Here are some must-have tools to help you solve performance issues.
PHP
PHP profilers are tools that work at the PHP level to analyze the performance of your application and find bottlenecks inside your code.
-
Code Profiler: Our WordPress plugin allows you to profile your site from your WordPress admin dashboard and to quickly find any potential problem in your themes and plugins. It generates an extremely detailed and easy to read analysis in the form of charts and tables that shows not only which plugin or theme, but also which PHP script, class, method and function is slowing down your website. It displays many useful additional information such as file I/O operations and disk I/O usage as well.
It makes it very simple to locate any bottleneck problem in your themes or plugins in order to solve it and speed up your website.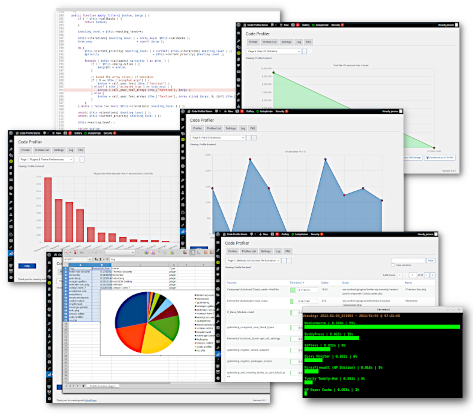
Free and premium versions available.

-
Xdebug:
Xdebug is a PHP extension that provides debugging and profiling capabilities. Because it's an extension, you will need root access to install, activate and configure it.
You will also need a profile data visualization tool to read data files generated by Xdebug. The most popular ones are KCachegrind, a Linux application (screenshot below), and Webgrind, a web frontend in PHP.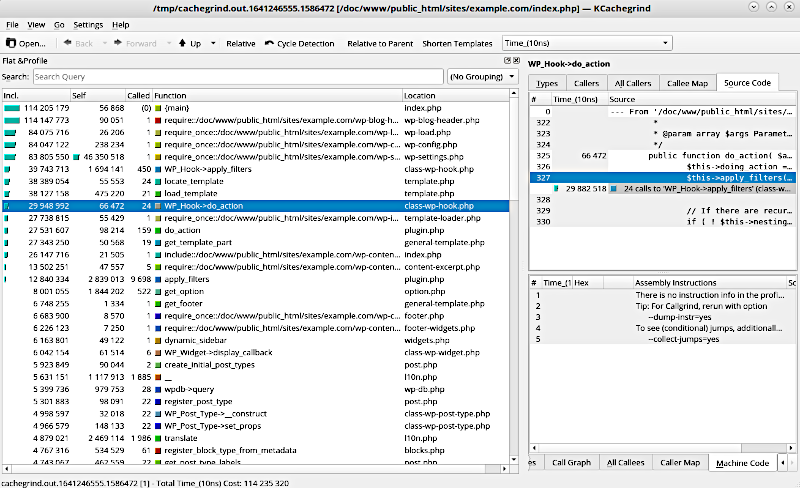

WordPress API
Those plugins work at the WordPress API level and offer different types of debugging and monitoring features.
-
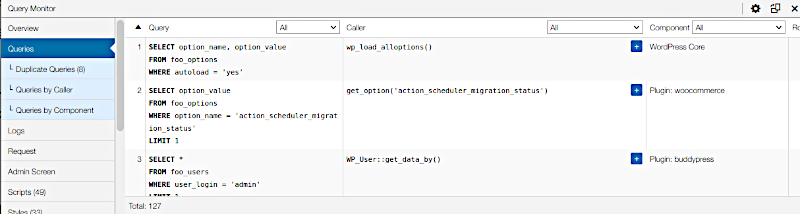
Query Monitor: A developer tools panel, it enables debugging of database queries, PHP errors, hooks and actions, block editor blocks, enqueued scripts and stylesheets, HTTP API calls.

-
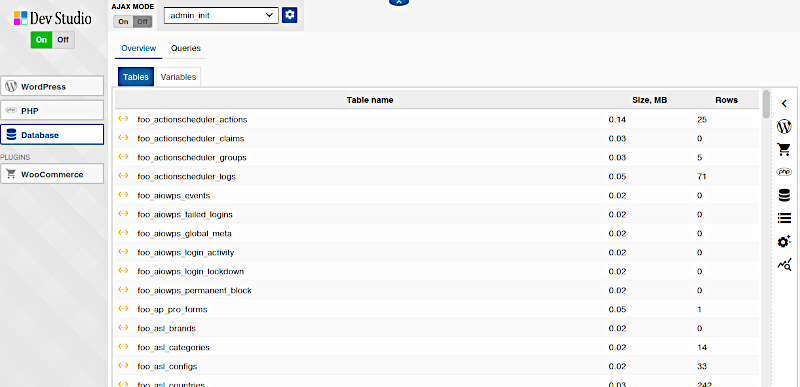
Dev Studio: A development environment for WordPress similar to Query Monitor.

-
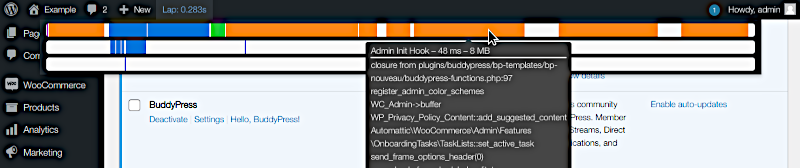
Laps: A plugin to display WordPress API calls in the admin bar.

Browser
Most recent browsers include a developer tools section with a "Network" tab that shows the time it takes to load JS code and CSS style sheets.
- Edge, Chrome and Chromium browsers:
CTRL + Shift + i - FireFox:
CTRL + Shift + e - Safari: See Web Development Tools

Errors
Errors too can slow down your site. Fortunately, WordPress includes two features to display them:
- WP_DEBUG: Enabling debugging in WordPress will show PHP errors, warnings and notices in your code:
- Edit your wp-config.php configuration script.
- Search for:
define('WP_DEBUG', false); - Replace it with:
define('WP_DEBUG', true); - Add this line below:
define('WP_DEBUG_LOG', true);
- Site Health: Available in the "Tools" section of your WordPress admin dashboard, it will show how your site is doing.